Showing posts with label GHG emissions. Show all posts

Thursday, April 14, 2022

Science-Based Targets SBT

 What are ‘science-based targets’?

Science-based targets provide a clearly-defined pathway for companies to reduce greenhouse gas (GHG) emissions, helping prevent the worst impacts of climate change and future-proof business growth.

Targets are considered ‘science-based’ if they are in line with what the latest climate science deems necessary to meet the goals of the Paris Agreement – limiting global warming to well-below 2°C above pre-industrial levels and pursuing efforts to limit warming to 1.5°C.

The private sector must play a fundamental role in reducing GHG emissions. Embedding science-based targets in sustainability management is crucial.

Setting a science-based target is a five-step process:

Commit: submit a letter establishing your intent to set a science-based target

Develop: work on an emissions reduction target in line with the SBTi’s criteria

Submit: present your target to the SBTi for official validation

Communicate: announce your target and inform your stakeholders

Disclose: report company-wide emissions and track target progress annually


Friday, February 4, 2022

Five ways in which Beijing 2022 will become carbon neutral

 In 2018, the total GHG baseline emissions covering the whole process of the Beijing 2022 Games were calculated at 1.637 million tonnes of CO2 equivalent, which were later revised in June 2021 to 1.306 million t-CO2e. As of June 2021, the 2016-2021 GHG emissions of the Beijing 2022 Games were calculated to be 489,000 t-CO2e.


Below are five ways in which Beijing 2022 organisers plan to achieve carbon neutrality.


1. Low-carbon venues


The first city in the world to host both a Summer and Winter Olympic Games, Beijing has been able to reuse many of its iconic venues, retrofitting them to reduce its footprint and maximise visibility of carbon-reducing solutions.


Five of the seven venues in the Beijing 2022 competition zone will be legacy venues from Beijing 2008, including the iconic “Bird’s Nest” National Stadium – which will host the Opening and Closing Ceremonies – and the Water Cube, which has been transformed from the Beijing 2008 swimming venue to the Ice Cube, to host the curling competitions.


All venues are expected to be powered by renewable energy while embracing new construction standards, from water and energy efficiency to building insulation and cooling technologies.


All newly-built venues have been certified with the highest national sustainability standards.


2. A push for renewables


For the first time in Olympic history, 100 per cent of the conventional electricity demand of all venues will be supplied by renewable energy. Accelerated by the Games, a new renewable power grid transfers wind and solar energy from Zhangjiakou to Beijing, supplying about 10 per cent of the city’s electricity consumption, as well as powering the Games.


3. Low-carbon transport


Fuel efficient and clean-energy vehicles will account for 100 per cent of all passenger cars and 85 per cent of all vehicles, including vehicles provided by Worldwide Olympic Partner Toyota. Transport within the Beijing Zone will mainly include electric and natural-gas-powered vehicles. In the Yanqing Zone and the Zhangjiakou Zone, hydrogen-fuelled vehicles will be deployed.


Opened as part of the preparations for the Games, a high-speed train connecting the three competition zones of Beijing, Yanqing and Zhangjiakou reduces travel time for the 174-kilometre journey from three hours to less than 60 minutes. 


4. Low-carbon ice cooling


Natural CO2 refrigeration systems will be used at four Beijing 2022 ice venues – the first time this low-climate-impact technology will be used in China and at the Olympic Winter Games.


The use of this technology reduces carbon emissions from the cooling process to nearly zero, cutting heat waste and energy consumption.


It is replacing hydrofluorocarbons (HFCs), traditionally used to cool ice rinks and proven to damage the Earth’s ozone layer and contribute to global warming.


5. Compensating through afforestation


Carbon sinks generated by afforestation projects in Beijing and Zhangjiakou will compensate emissions from the Games. Beijing and Zhangjiakou authorities have planted 47,333 and 33,000 hectares of forest and green areas respectively. After being verified and certified by a third-party certification body, approximately 530,000 and 570,000 tonnes of forestry carbon sequestration credits have been provided to Beijing 2022 to compensate its residual carbon emissions.


In response to the growing climate crisis, the IOC is constantly increasing its ambition to address it.


While all upcoming Games editions are required to be carbon-neutral, from 2030 onwards, the IOC will go a step further, obliging all Games to be “climate positive”. This means that organisers will be required to reduce direct and indirect emissions of the Games, compensate more than the remaining ones, and create lasting zero-carbon solutions for the Games and beyond.


Paris 2024 has committed to achieving this goal already in 2024.


Tokyo 2020 went beyond carbon neutrality, by reducing its carbon footprint and compensating more than its remaining emissions.


The IOC itself will halve its own footprint by 2030 and create an Olympic Forest to become climate positive in 2024.


Source: https://olympics.com/ioc/news/five-ways-in-which-beijing-2022-will-become-carbon-neutral

Saturday, October 9, 2021

Bravo, owner of Citybus and New World First Bus, supports Hong Kong’s Carbon Neutrality Task Force for its foresight and vision in considering hydrogen solutions for the future decarbonisation of the region. As an advocate of clean energy mobility solutions, Bravo was delighted to be invited to present to the Environmental Protection Department’s Carbon Neutrality Task Force at their first formal workshop. Bravo shareholder, Ascendal Group, shared their past experience of leading world-class hydrogen bus services in London from 2011, with coshareholder, Hans Energy, presenting possible options for sourcing and distributing hydrogen within Hong Kong. Bravo first launched electric bus services on Hong Kong Island in December 2015 operating on Routes 11, 12, 25A, 78 and 81. The company continues to invest in zero emission solutions, with three new electric charging stations being installed at Hong Kong Station Bus Terminus, Central Ferry Bus Terminus, and Kai Tak Cruise Terminal Bus Terminus before the end of the year. However, for long distance or high frequency services in Hong Kong, battery electric buses face many operational challenges given the local climate and topography.

We have more Logistic Emission Calculation modules

  1. Rail Freight Emission Calculation Module
  2. Air Freight Emission Calculation Module
  3. Vehicle Freight Emission Calculation Module

Sustainable Development Goals Achievement:

Schedule a free demo now. Visit https://www.ideoconcepts.com/contact-us/ for more information

Source: https://www.bravobus.com.hk/en/uploadedPressRelease/18486_10062021_H_eng.pdf

 Bravo, owner of Citybus and New World First Bus, supports Hong Kong’s Carbon Neutrality Task Force for its foresight and vision in considering hydrogen solutions for the future decarbonisation of the region. As an advocate of clean energy mobility solutions, Bravo was delighted to be invited to present to the Environmental Protection Department’s Carbon Neutrality Task Force at their first formal workshop. Bravo shareholder, Ascendal Group, shared their past experience of leading world-class hydrogen bus services in London from 2011, with coshareholder, Hans Energy, presenting possible options for sourcing and distributing hydrogen within Hong Kong. Bravo first launched electric bus services on Hong Kong Island in December 2015 operating on Routes 11, 12, 25A, 78 and 81. The company continues to invest in zero emission solutions, with three new electric charging stations being installed at Hong Kong Station Bus Terminus, Central Ferry Bus Terminus, and Kai Tak Cruise Terminal Bus Terminus before the end of the year. However, for long distance or high frequency services in Hong Kong, battery electric buses face many operational challenges given the local climate and topography.

We have more Logistic Emission Calculation modules

  1. Rail Freight Emission Calculation Module
  2. Air Freight Emission Calculation Module
  3. Vehicle Freight Emission Calculation Module

Sustainable Development Goals Achievement:

Schedule a free demo now. Visit https://www.ideoconcepts.com/contact-us/ for more information

Source: https://www.bravobus.com.hk/en/uploadedPressRelease/18486_10062021_H_eng.pdf

Friday, October 8, 2021

Hong Kong to phase out coal as a power generation source by 2035

 Chief Executive Carrie Lam Cheng Yuet-ngor gave greater emphasis to climate initiatives in Wednesday’s policy address than in her previous speeches, laying out clearer goals for putting the city’s fuel mix on a greener footing. As carbon dioxide is the major culprit in climate change. Measures include saving energy and designing greener buildings, as well as less polluting forms of transport and better waste management. Those sectors together emit 90 per cent of the city’s greenhouse gases.


  • online / cloud based system monitoring of resources consumption on a per-location basis, consumption types include :-
    • Electricity Consumption
    • Fuel Consumption
    • Gas Consumption
    • Lubricant / Refrigerant / Steam / Material / Paper Consumption
    • Business Travel analysis
    • Air / Road / Sea Freight Logistics Consumption
    • Social Responsibility Dataset
    • Health & Safety Summary
    • CSR and Environment Investment
  • Collection of Waste Management data
  • Highly customizable time-series data (e.g. No of staff, Productivity, total office area)

Please Schedule a demo https://www.ideoconcepts.com/contact-us/ for more information

Tuesday, December 31, 2019

Fossil CO2 and GHG emissions of all world countries, 2019

The global GHG emissions trend has increased since the beginning of the 21st century in comparison to the three previous decades, mainly due to the increase in CO2 emissions from China and the other emerging economies. As a result, the atmospheric concentrations of greenhouse gases substantially increased enhancing the natural greenhouse effect, which may negatively affect the life on the Earth. These issues are internationally addressed in the framework of UNFCCC; countries are developing national emissions inventories and propose/implement actions to mitigate GHG emissions. CO2 emissions, which are the main responsible for global warming are still increasing at world level despite climate change mitigation agreements. However, CO2 emissions within the EU28 have decreased in the last two decades. Human related activities largely influence the total CO2 emissions – particularly, power generation and road transport but also emissions from combustion in the residential and commercial sectors play a key role. Despite decreasing trends for total EU28 CO2 emissions, CO2 emissions per capita within the EU28 are still higher than the world average value.


Read more at https://edgar.jrc.ec.europa.eu/overview.php?v=booklet2019

Friday, August 30, 2019

California Greenhouse Gas Emissions for 2000 to 2017 Trends of Emissions and Other Indicators

The annual statewide greenhouse gas (GHG) emission inventory is an important tool in
tracking progress towards meeting statewide GHG goals. The inventory for 2017 shows that
California’s GHG emissions continue to decrease. In 2017, emissions from GHG emitting
activities statewide were 424 million metric tons of CO2 equivalent (MMTCO2e), 5 MMTCO2e
lower than 2016 levels and 7 MMTCO2e below the 2020 GHG Limit of 431 MMTCO2e.
Consistent with recent years, these reductions have occurred while California’s economy has
continued to grow and generate jobs. Compared to 2016, California’s GDP grew 3.6 percent
while the carbon intensity of its economy declined by 4.5 percent. The most notable highlights in
the inventory include:
• For the first time since California started to track GHG emissions, in-state and total
electricity generation from zero-GHG sources (for purposes of the GHG inventory,
these include solar, hydro, wind, and nuclear) exceeded generation from GHGemitting sources.
• The transportation sector remains the largest source of GHG emissions in the state,
but saw a 1 percent increase in emissions in 2017, the lowest growth rate over the
past 4 years.
• Emissions from all other sectors have remained relatively constant in recent years,
although emissions from high Global Warming Potential (GWP) gases have continued
to increase as they replace Ozone Depleting Substances (ODS) banned under the
1987 Montreal Protocol.

source: https://ww3.arb.ca.gov/cc/inventory/pubs/reports/2000_2017/ghg_inventory_trends_00-17.pdf

Thursday, August 15, 2019

Transportation GHG emissions

GHG spotlight on transportation
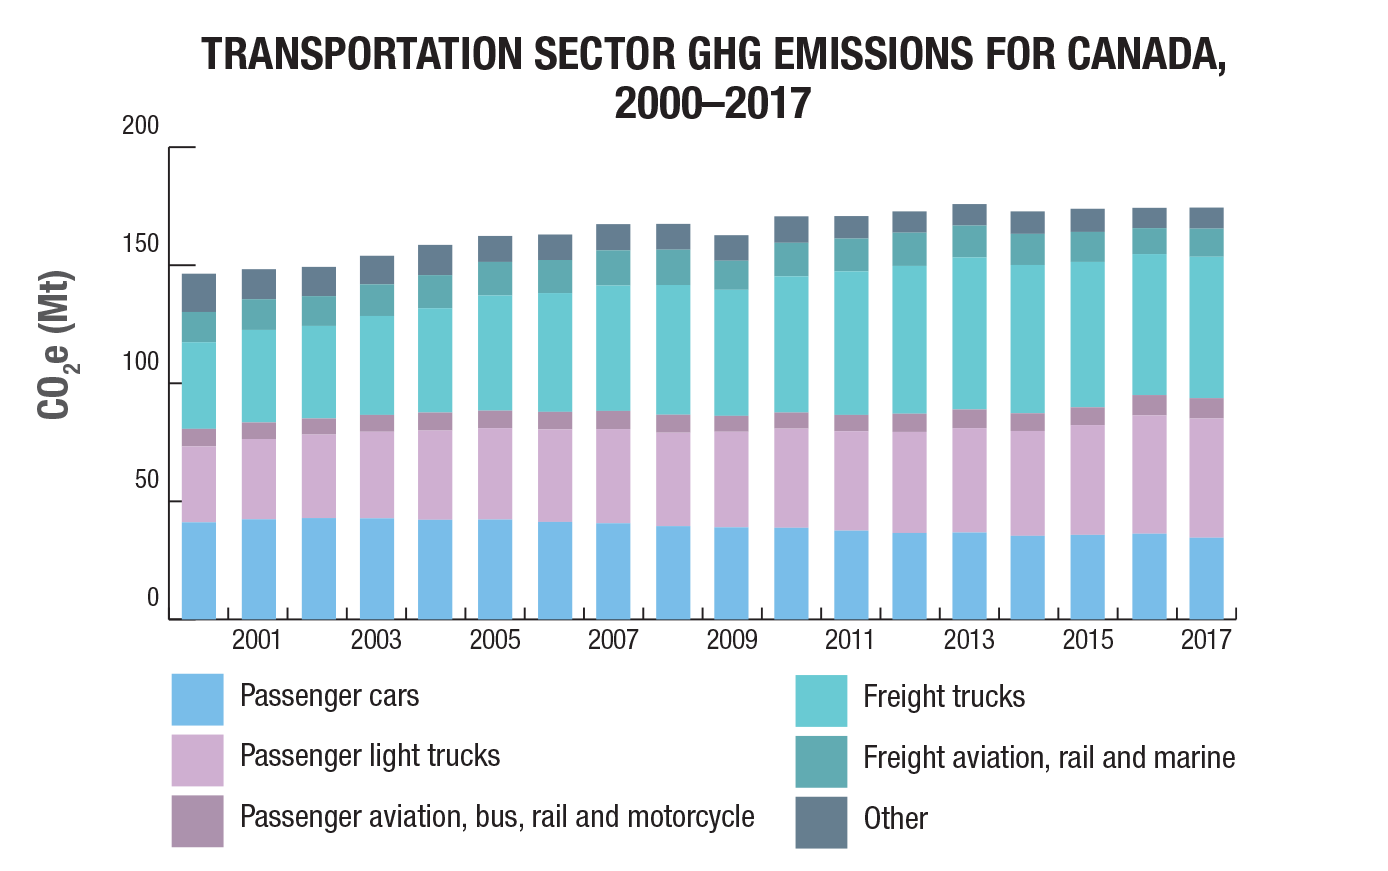
Transportation GHG emissions have increased 19% from 2000 to 2017. Emissions from passenger light trucks and freight trucks have continued to rise due to an increased number of vehicles (especially light trucks and SUVs). Freight emissions have increased due to many factors including increasing trade and globalization, and online shopping.


Passenger transportation contributes 54% to total emissions, freight emissions are 41% of total and off-road is 5%.

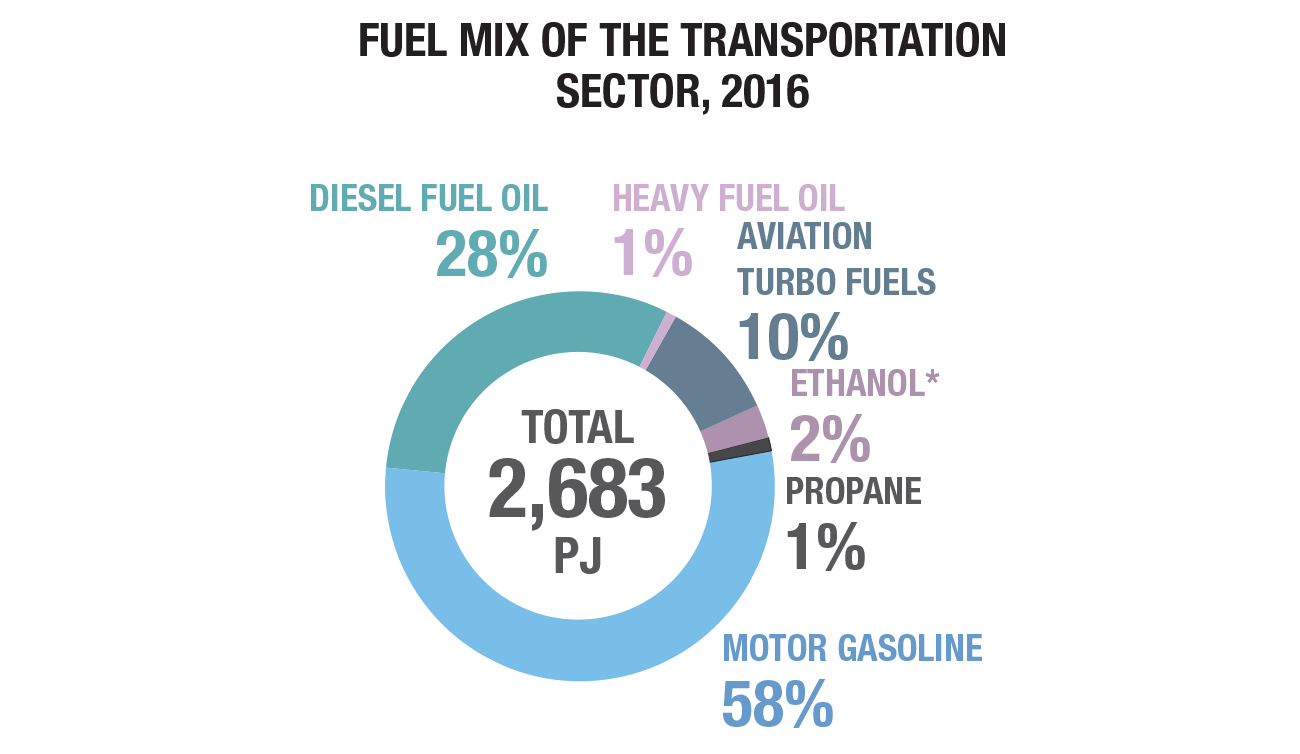
Energy efficiency improvements in the transportation sector have saved Canadians 763 PJ of energy and almost $20.8 billion in energy costs in 2016.

Total transportation energy use increased 16% from 2000 to 2016.


Source: https://www.nrcan.gc.ca/energy-and-greenhouse-gas-emissions-ghgs/20063#L1

Total electricity emissions / GHG emissions on electricity

GHG spotlight on electricity
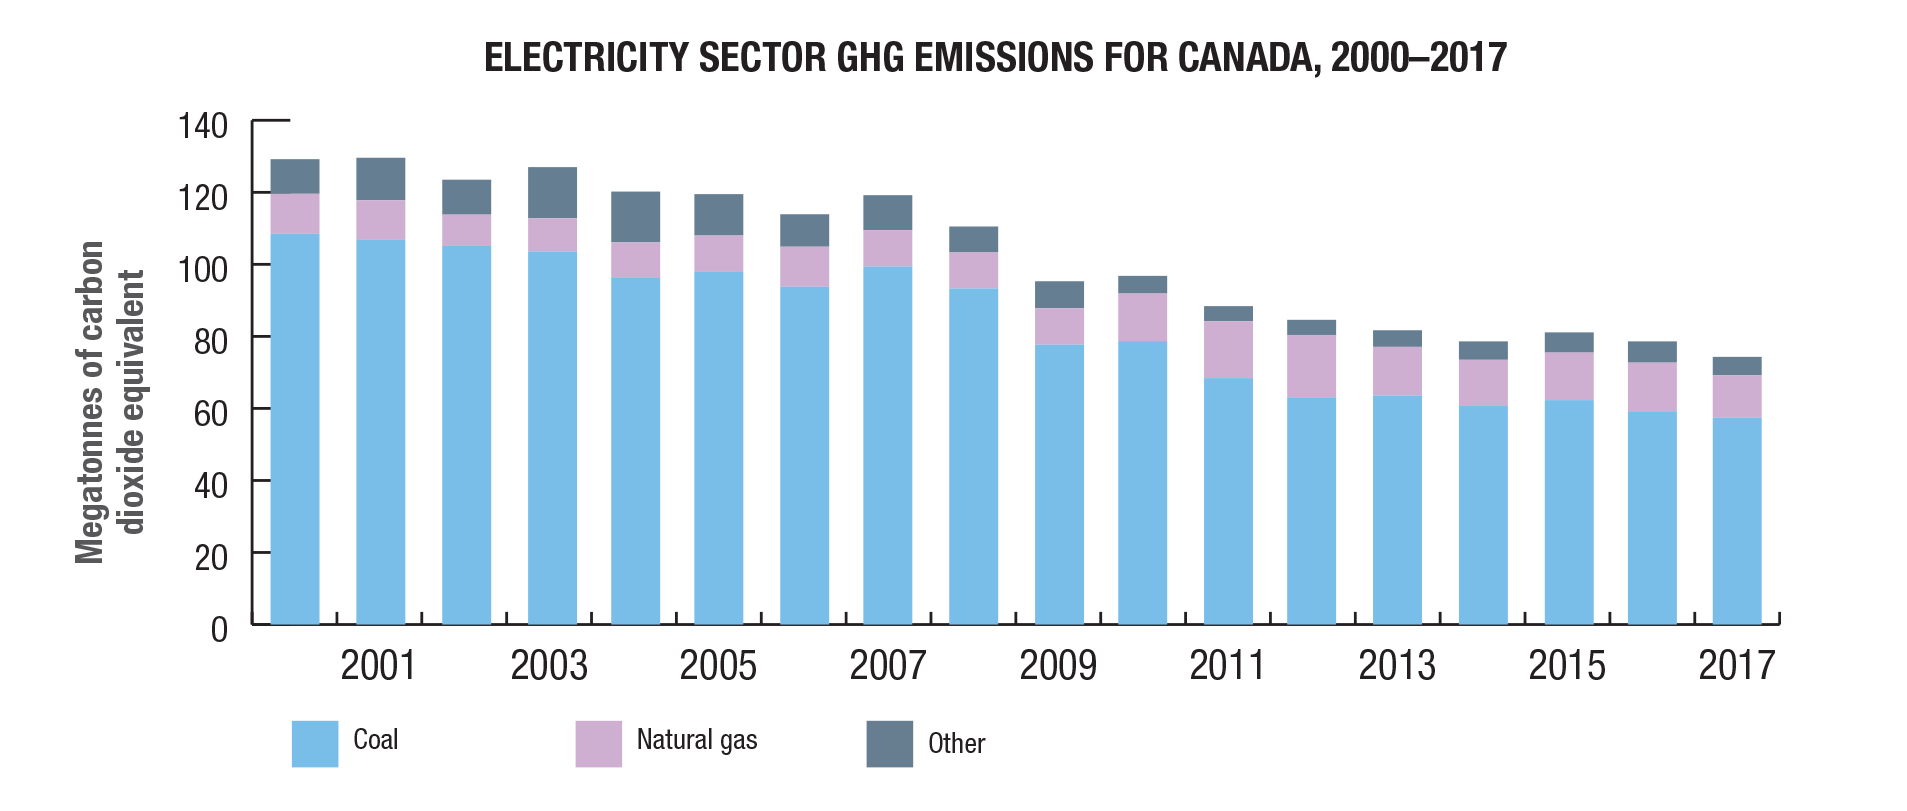
Despite accounting for less than 9% of total electricity generation, coal was responsible for 77% of electricity related GHG emissions in 2017. Total electricity emissions decreased by 42% from 2000 to 2017 due to increased generation from non-emitting sources.


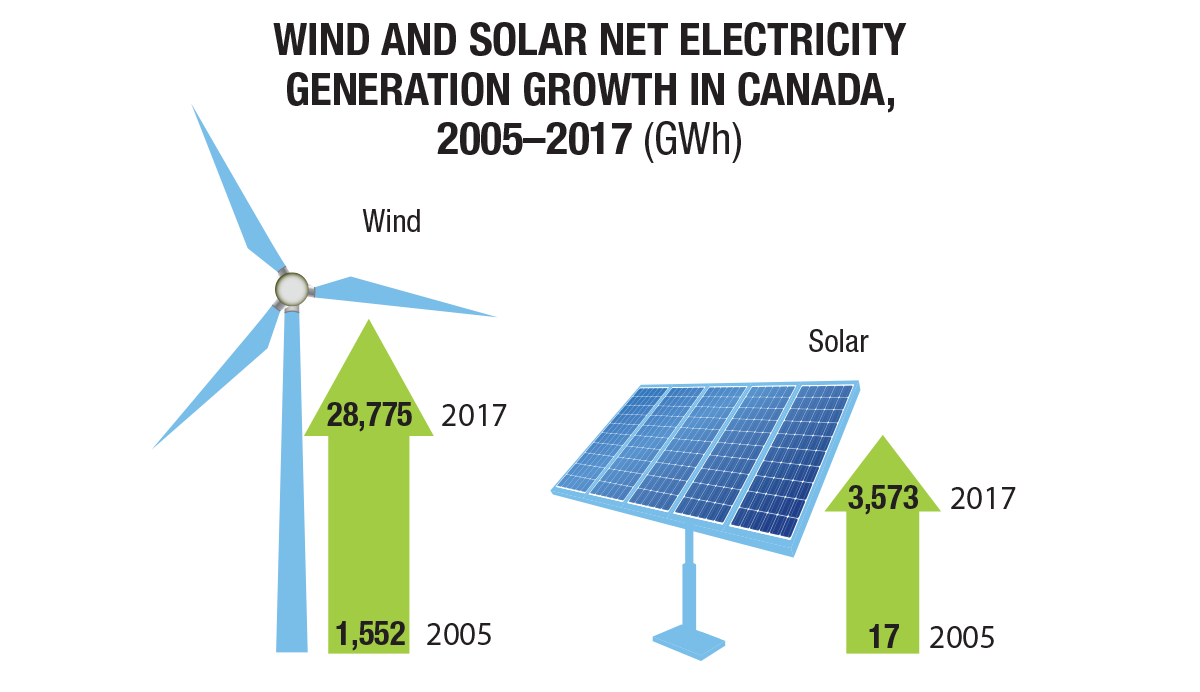
Renewable electricity generation has increased 18% between 2010 and 2017, with solar and wind having largest growth.

In 2017, almost 82% of electricity in Canada came from non-GHG emitting sources. Hydro made up 60%, nuclear 15%, and other renewables the remaining 7%.

Renewable energy sources make up 2/3’s of Canada’s electricity mix. Renewable electricity generation has increased 18% between 2010 and 2017, with solar and wind having largest growth.


Source: https://www.nrcan.gc.ca/energy-and-greenhouse-gas-emissions-ghgs/20063#L1