Showing posts with label CO2. Show all posts

Thursday, April 14, 2022

New Balance says its sneakers will leave zero carbon footprint by 2050

 The World Bank says the fashion industry is responsible for about 10% of global emissions, leading some brands to take stock of their outsized carbon footprints.

New Balance Athletics operates three factories in Maine and has pledged to be net zero by 2050. The company's factories churn out thousands of sneakers every day.

An MIT lifecycle assessment estimates that producing just one pair of running shoes generates 30 pounds of carbon dioxide emissions. That's because it's an energy intensive process that uses cotton, leather and oil-dependent polyester. It also generates a lot of waste.


Wednesday, March 16, 2022

Emission factors for each mode of transport

 Emission factors for each mode of transport (e.g., aircraft, rail, metro, bus, taxi, bus), expressed in units of greenhouse gas (CO2, CH4, N2O, HFC, or CO2e) emitted per kilometer or per passenger-kilometer travelled.


Friday, February 4, 2022

Five ways in which Beijing 2022 will become carbon neutral

 In 2018, the total GHG baseline emissions covering the whole process of the Beijing 2022 Games were calculated at 1.637 million tonnes of CO2 equivalent, which were later revised in June 2021 to 1.306 million t-CO2e. As of June 2021, the 2016-2021 GHG emissions of the Beijing 2022 Games were calculated to be 489,000 t-CO2e.


Below are five ways in which Beijing 2022 organisers plan to achieve carbon neutrality.


1. Low-carbon venues


The first city in the world to host both a Summer and Winter Olympic Games, Beijing has been able to reuse many of its iconic venues, retrofitting them to reduce its footprint and maximise visibility of carbon-reducing solutions.


Five of the seven venues in the Beijing 2022 competition zone will be legacy venues from Beijing 2008, including the iconic “Bird’s Nest” National Stadium – which will host the Opening and Closing Ceremonies – and the Water Cube, which has been transformed from the Beijing 2008 swimming venue to the Ice Cube, to host the curling competitions.


All venues are expected to be powered by renewable energy while embracing new construction standards, from water and energy efficiency to building insulation and cooling technologies.


All newly-built venues have been certified with the highest national sustainability standards.


2. A push for renewables


For the first time in Olympic history, 100 per cent of the conventional electricity demand of all venues will be supplied by renewable energy. Accelerated by the Games, a new renewable power grid transfers wind and solar energy from Zhangjiakou to Beijing, supplying about 10 per cent of the city’s electricity consumption, as well as powering the Games.


3. Low-carbon transport


Fuel efficient and clean-energy vehicles will account for 100 per cent of all passenger cars and 85 per cent of all vehicles, including vehicles provided by Worldwide Olympic Partner Toyota. Transport within the Beijing Zone will mainly include electric and natural-gas-powered vehicles. In the Yanqing Zone and the Zhangjiakou Zone, hydrogen-fuelled vehicles will be deployed.


Opened as part of the preparations for the Games, a high-speed train connecting the three competition zones of Beijing, Yanqing and Zhangjiakou reduces travel time for the 174-kilometre journey from three hours to less than 60 minutes. 


4. Low-carbon ice cooling


Natural CO2 refrigeration systems will be used at four Beijing 2022 ice venues – the first time this low-climate-impact technology will be used in China and at the Olympic Winter Games.


The use of this technology reduces carbon emissions from the cooling process to nearly zero, cutting heat waste and energy consumption.


It is replacing hydrofluorocarbons (HFCs), traditionally used to cool ice rinks and proven to damage the Earth’s ozone layer and contribute to global warming.


5. Compensating through afforestation


Carbon sinks generated by afforestation projects in Beijing and Zhangjiakou will compensate emissions from the Games. Beijing and Zhangjiakou authorities have planted 47,333 and 33,000 hectares of forest and green areas respectively. After being verified and certified by a third-party certification body, approximately 530,000 and 570,000 tonnes of forestry carbon sequestration credits have been provided to Beijing 2022 to compensate its residual carbon emissions.


In response to the growing climate crisis, the IOC is constantly increasing its ambition to address it.


While all upcoming Games editions are required to be carbon-neutral, from 2030 onwards, the IOC will go a step further, obliging all Games to be “climate positive”. This means that organisers will be required to reduce direct and indirect emissions of the Games, compensate more than the remaining ones, and create lasting zero-carbon solutions for the Games and beyond.


Paris 2024 has committed to achieving this goal already in 2024.


Tokyo 2020 went beyond carbon neutrality, by reducing its carbon footprint and compensating more than its remaining emissions.


The IOC itself will halve its own footprint by 2030 and create an Olympic Forest to become climate positive in 2024.


Source: https://olympics.com/ioc/news/five-ways-in-which-beijing-2022-will-become-carbon-neutral

Friday, November 12, 2021

UK: COP26 declaration on accelerating the transition to 100% zero emission cars and vans

 As representatives of governments, businesses, and other organisations with an influence over the future of the automotive industry and road transport, we commit to rapidly accelerating the transition to zero emission vehicles to achieve the goals of the Paris Agreement[footnote 1].


Together, we will work towards all sales of new cars and vans being zero emission[footnote 2] globally by 2040, and by no later than 2035 in leading markets


A. As governments, we will work towards all sales of new cars and vans being zero emission by 2040 or earlier, or by no later than 2035 in leading markets.


B. As governments in emerging markets and developing economies, we will work intensely towards accelerated proliferation and adoption of zero emission vehicles. We call on all developed countries to strengthen the collaboration and international support offer to facilitate a global, equitable and just transition.


C. As cities, states, and regional governments, we will work towards converting our owned or leased car and van fleets to zero emission vehicles by 2035 at the latest, as well as putting in place policies that will enable, accelerate, or otherwise incentivise the transition to zero emission vehicles as soon as possible, to the extent possible given our jurisdictional powers.


D. As automotive manufacturers, we will work towards reaching 100% zero emission new car and van sales in leading markets by 2035 or earlier, supported by a business strategy that is in line with achieving this ambition, as we help build customer demand.


E. As business fleet owners and operators, or shared mobility platforms, we will work towards 100% of our car and van fleets being zero emission vehicles by 2030, or earlier where markets allow.

Source: https://www.gov.uk/government/publications/cop26-declaration-zero-emission-cars-and-vans/cop26-declaration-on-accelerating-the-transition-to-100-zero-emission-cars-and-vans

Eco Emission Data Management System, which developed and integrated with open services (Google Distance API)  have more Logistic Emission Calculation modules

  1. Rail Freight Emission Calculation Module
  2. Air Freight Emission Calculation Module
  3. Vehicle Freight Emission Calculation Module

Ocean Freight are in beta testing and will be available on 2020 First quarter.

Sustainable Development Goals Achievement:

Schedule a free demo now. Visit https://www.ideoconcepts.com/contact-us/ for more information


Friday, June 25, 2021

Rail Freight Module for Freight CO2 Emission Calculation

 Freight train emissions  27.5g CO2e per tonne km in 2019-20 Increase of 8.6% compared to 2018-19 The amount of diesel consumed by freight trains in 2019-20 has increased by 12.5% to 172 million litres. This is the highest figure since 2015-16, and the first time that diesel use increased year on year since 2015-16. Electricity usage fell by 6.3% to 70 million kWh. The resulting CO2e emissions for freight trains have increased to 27.5g CO2e per tonne km. This is the highest level since the comparable time series started in 2011-12.

Please contact us https://www.ideoconcepts.com/ for more information

Professional ocean freight carbon calculation for sea-routes Asia and Europe and UK

Sea transportation the word busiest cargo transportation between Europe, UK, Asia and China. Sustainability for Logistics forwarders and shippers  with vessel operator service providers is in high demand from their customer for cleaner cargo with lower carbon output.

With our Ocean Carbon CO2 Emission Calculation Module (1 of the 3 logistics sections, including Air Carbon CO2 Emission Calculation  Module and Road Carbon CO2 Emission Calculation Module),  Well-presented dashboard data and analytics software gives your company in-depth view in statistics charts. Emission Factors as the key provided by cargo's companies gave you most up-to-date analytics calculation. IATA code for Port, Airport and station provided accurate location address for countries/regions in the world for data summarized with NOx, SOx and PM calculator.

Reach us http://www.ic.com.hk for further information.

Thursday, June 24, 2021

China's Shandong to limit carbon emission at new industrial projects

China's industrial hub Shandong province pledged to tighten new approval of industries such as oil refining and aluminium smelting which have high energy use and high emissions as Beijing strives to meet climate change targets.

The steps come as China vowed to start cutting carbon emissions before 2030 and become carbon neutral by 2060.

Source: https://www.reuters.com/business/sustainable-business/chinas-shandong-limit-carbon-emission-new-industrial-projects-2021-06-22/

Thursday, March 25, 2021

One of the world biggest floating solar farms is in Singapore

 It comprises 13,312 panels, 40 inverters and more than 30,000 floats.

The solar farm is equipped with electrical panels, control systems and a 22 kilovolttransformer.

The energy it harvests is capable of potentially offsetting 4,258 tonnes of carbon dioxide per year -- equivalent to the greenhouse gas emissions from more than 900 passenger vehicles a year.

In geek terms: The 5MW-peak system installation is expected to produce an estimated 6 million kilowatt hours of energy per year.

Source: https://mothership.sg/2021/03/largest-floating-solar-farms-singapore/

Friday, March 19, 2021

What is carbon dioxide emission? Expert Q&A - Sustainability Gallery S Gallery

Carbon dioxide is the main type of greenhouse gas emission, and carbon dioxide emission (i.e. carbon emission) is the average greenhouse gases emission of the production, trafficking, using and recycling of a certain product. All human activities emits carbon dioxides, but it can be reduced by decreasing industrial, enterprise carbon emission and pollution, and leading sustainable ways of lives. It would become the most important topic to be discussed in this century.

Friday, December 11, 2020

Fashion Industry Charter for Climate Action (the “Charter”) under the United Nations Climate Change

Crystal has been working relentlessly to reduce carbon emission under the third Global 5-year Sustainability Targets and planning to tackle climate risk holistically. In 2020, the Company completed a study to develop a roadmap for long-term carbon reduction. In 2019, a rooftop solar energy system consisting of around 600kW was installed in the intimate factory in Vietnam, anticipating to reduce the emissions by approximately 500 tCO2e every year. Crystal International plans to progressively scale up the adoption of renewable energy in all operating countries in the foreseeable future.

Sunday, June 7, 2020

International flights UK emissions targets now

Transport and Environment says airline industry bailout should have green conditions attached

International flights taking off from the UK must be taken into account in the government’s calculations on reaching net zero emissions as part of a “green” recovery for the airline industry, a transport thinktank has urged.

The government has given loan bailouts to airlines totalling £1.5bn since the coronavirus outbreak, with no environmental conditions attached.

Source: https://www.theguardian.com/environment/2020/jun/04/count-international-flights-from-uk-in-emissions-targets-urges-thinktank#maincontent

Saturday, June 6, 2020

Atmospheric CO2 levels rise sharply despite Covid-19 lockdowns

Scientists find coronavirus crisis has had little impact on overall concentration trend

Carbon dioxide levels in the atmosphere have risen strongly to a new peak this year, despite the impact of the global effects of the coronavirus crisis.

The concentration of CO2 in the atmosphere reached 417.2 parts per million in May, 2.4ppm higher than the peak of 414.8ppm in 2019, according to readings from the Mauna Loa observatory in the US.

Without worldwide lockdowns intended to slow the spread of Covid-19, the rise might have reached 2.8ppm, according to Ralph Keeling, a professor at the Scripps Institution of Oceanography. He said it was likely they had played a small role, but that the difference was too small to show up against other factors causing year-to-year fluctuations.

Source: https://www.theguardian.com/environment/2020/jun/04/atmospheric-co2-levels-rise-sharply-despite-covid-19-lockdowns

Friday, June 5, 2020

Earth’s carbon dioxide levels hit record high, despite coronavirus-related emissions drop

There probably is more carbon dioxide in the air now than at anytime in 3 million years
The coronavirus pandemic’s economic downturn may have set off a sudden plunge in global greenhouse gas emissions, but another crucial metric for determining the severity of global warming — the amount of greenhouse gases actually in the air — just hit a record high.

Friday, May 29, 2020

Environmental Management System and API token driven json dataset, Monitoraggio del consumo di risorse in base alla posizione, 監視每個位置的資源消耗,消耗類型

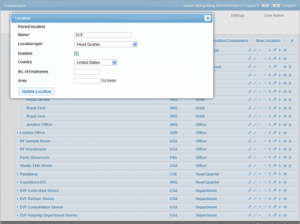
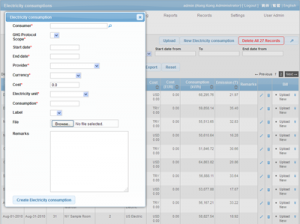
  • online / cloud based system monitoring of resources consumption on a per-location basis, consumption types include :-
    • Electricity Consumption
    • Fuel Consumption
    • Gas Consumption
    • Lubricant / Refrigerant / Steam / Material / Paper Consumption 
    • Business Travel analysis
    • Air / Road / Sea Freight Logistics Consumption
    • Social Responsibility Dataset
    • Health & Safety Summary
    • CSR and Environment Investment
  • Collection of Waste Management data
  • Highly customizable time-series data (e.g. No of staff, Productivity, total office area)
  • Social Survey/Questionnaire 
  • Risk Management
  • Multi-Domain / Department structure support from SME to multi-nations organization
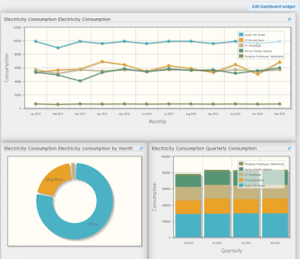
  • WYSIWYG dashboard admin
  • Multi-Lingual (English, Japanese, Franch, Spanish, Trad/Simp Chinese, etc)
  • API data CRUD
  • Misc Configuration - Currencies, Counties, IATA, Emission factors, Themes,
  • Variance check
  • User Management and module-based access control
  • Yearly-based Emission Factor for consumptions
  • Reporting on consumption and cost
  • Reporting on CO2/NOX/SOX/PM Emission
  • Reporting on Intensity/Target/Year-on-year based
  • Record and Document Management on
    • Investments in Environmental Projects
    • Environmental Issues and Non Compliance Records
    • Training Records
    • Environmental Audits

監視每個位置的資源消耗,消耗類型包括:
用電量
燃油消耗
耗氣量
潤滑劑/製冷劑/蒸汽/材料/紙張消耗
商務旅行分析
空/陸/海貨運物流消耗
社會責任數據集
健康與安全摘要
企業社會責任與環境投資
廢物管理數據收集
高度可定制的時間序列數據(例如,員工人數,生產率,總辦公面積)
社會調查/問卷
風險管理
從中小企業到跨國組織的多域/部門結構支持
所見即所得的儀表板管理員
多國語言(英語,日語,法語,西班牙語,繁體/簡體中文等)
API數據CRUD
其他配置-貨幣,縣,IATA,排放因子,主題,
差異檢查
用戶管理和基於模塊的訪問控制
年度年度排放因子
消耗和成本報告
關於CO2 / NOX / SOX / PM排放的報告
基於強度/目標/同比的報告
記錄和文件管理
環保項目投資
環境問題和違規記錄
訓練記錄
環境審核
Surveillance de la consommation des ressources par emplacement, les types de consommation comprennent: -
La consommation d'électricité
Consommation de carburant
Consommation de gaz
Lubrifiant / réfrigérant / vapeur / matériel / consommation de papier
Analyse des voyages d'affaires
Consommation logistique de fret aérien / routier / maritime
Ensemble de données sur la responsabilité sociale
Résumé sur la santé et la sécurité
Investissement RSE et Environnement
Collecte de données sur la gestion des déchets
Données de séries chronologiques hautement personnalisables (par exemple, nombre d'employés, productivité, surface totale de bureau)
Enquête sociale / Questionnaire
Gestion des risques
Support de structure multi-domaine / département de la PME à l'organisation multi-nations
Administrateur du tableau de bord WYSIWYG
Multilingue (anglais, japonais, français, espagnol, chinois traditionnel / chinois simp, etc.)
API data CRUD
Configurations diverses - devises, comtés, IATA, facteurs d'émission, thèmes,
Contrôle d'écart
Gestion des utilisateurs et contrôle d'accès basé sur les modules
Facteur d'émission annuel pour les consommations
Reporting sur la consommation et les coûts
Rapports sur les émissions de CO2 / NOX / SOX / PM
Rapports sur l'intensité / la cible / sur une base annuelle
Gestion des enregistrements et des documents sur
Investissements dans des projets environnementaux
Dossiers sur les problèmes environnementaux et la non-conformité
Dossiers de formation
Audits environnementaux
监视每个位置的资源消耗,消耗类型包括:
用电量
燃油消耗
耗气量
润滑剂/制冷剂/蒸汽/材料/纸张消耗
商务旅行分析
空/陆/海货运物流消耗
社会责任数据集
健康与安全摘要
企业社会责任与环境投资
废物管理数据收集
高度可定制的时间序列数据(例如,员工人数,生产率,总办公面积)
社会调查/问卷
风险管理
从中小企业到跨国组织的多域/部门结构支持
所见即所得的仪表板管理员
多国语言(英语,日语,法语,西班牙语,繁体/简体中文等)
API数据CRUD
其他配置-货币,县,IATA,排放因子,主题,
差异检查
用户管理和基于模块的访问控制
年度年度排放因子
消耗和成本报告
关于CO2 / NOX / SOX / PM排放的报告
基于强度/目标/同比的报告
记录和文件管理
环保项目投资
环境问题和违规记录
训练记录
环境审核
Kaynak tüketiminin yere göre izlenmesi, tüketim türleri şunları içerir:
Elektrik tüketimi
Yakıt tüketimi
Gaz tüketimi
Yağlayıcı / Soğutucu / Buhar / Malzeme / Kağıt Tüketimi
İş Seyahati analizi
Hava / Yol / Deniz Taşımacılığı Lojistik Tüketimi
Sosyal Sorumluluk Veri Kümesi
Sağlık ve Güvenlik Özeti
KSS ve Çevre Yatırımı
Atık Yönetimi verilerinin toplanması
Son derece özelleştirilebilir zaman serisi verileri (örn. Personel sayısı, Verimlilik, toplam ofis alanı)
Sosyal Anket / Anket
Risk yönetimi
KOBİ'lerden çok uluslu kuruluşlara Çok Alanlı / Departman yapısı desteği
WYSIWYG kontrol paneli yöneticisi
Çok Dilli (İngilizce, Japonca, Franch, İspanyolca, Trad / Simp Çince, vb.)
API verileri CRUD
Çeşitli Yapılandırma - Para Birimleri, İlçeler, IATA, Emisyon faktörleri, Temalar,
Varyans kontrolü
Kullanıcı Yönetimi ve modül tabanlı erişim kontrolü
Tüketim için Yıllık Bazlı Emisyon Faktörü
Tüketim ve maliyet raporlaması
CO2 / NOX / SOX / PM Emisyonu Hakkında Raporlama
Yoğunluk / Hedef / Yıllık bazda raporlama
Kayıt ve Belge Yönetimi
Çevre Projelerine Yatırımlar
Çevre Sorunları ve Uygunsuzluk Kayıtları
Eğitim kayıtları
Çevresel Denetimler
ロケーションごとのリソース消費のモニタリング。消費タイプには次のものが含まれます。
電力消費
燃費
ガス消費
潤滑油/冷媒/蒸気/素材/紙の消費
出張分析
航空/道路/海上貨物の消費
社会的責任データセット
健康と安全の概要
CSRと環境投資
廃棄物管理データの収集
高度にカスタマイズ可能な時系列データ(例:スタッフ数、生産性、総オフィス面積)
社会調査・アンケート
危機管理
中小企業から多国籍組織へのマルチドメイン/部門構造のサポート
WYSIWYGダッシュボード管理者
多言語対応(英語、日本語、フランス語、スペイン語、繁体字/簡体字中国語など)
APIデータCRUD
その他の構成-通貨、郡、IATA、排出係数、テーマ、
分散チェック
ユーザー管理とモジュールベースのアクセス制御
消費量の年間ベースの排出係数
消費とコストの報告
CO2 / NOX / SOX / PM排出量の報告
強度/ターゲット/前年ベースのレポート
の記録とドキュメントの管理
環境プロジェクトへの投資
環境問題とコンプライアンス違反の記録
研修記録
環境監査
Monitoraggio del consumo di risorse su base per località, i tipi di consumo includono: -
Consumo elettrico
Consumo di carburante
Consumo di gas
Consumo di lubrificante / refrigerante / vapore / materiale / carta
Analisi dei viaggi d'affari
Consumo di logistica di trasporto aereo / stradale / marittimo
Set di dati sulla responsabilità sociale
Riepilogo salute e sicurezza
CSR e investimenti ambientali
Raccolta di dati sulla gestione dei rifiuti
Dati di serie temporali altamente personalizzabili (ad es. Numero di dipendenti, produttività, area ufficio totale)
Social Survey / Questionnaire
Gestione del rischio
Supporto della struttura multi-dominio / dipartimento dalle PMI all'organizzazione multi-nazione
Amministratore dashboard WYSIWYG
Multilingue (inglese, giapponese, francese, spagnolo, cinese tradizionale / ecc.)
Dati API CRUD
Configurazione mista: valute, contee, IATA, fattori di emissione, temi,
Controllo della varianza
Gestione utenti e controllo degli accessi basato su moduli
Fattore di emissione su base annua per i consumi
Segnalazione di consumi e costi
Segnalazione delle emissioni di CO2 / NOX / SOX / PM
Rapporti su intensità / obiettivo / anno su anno
Gestione record e documenti attivata
Investimenti in progetti ambientali
Problemi ambientali e record di non conformità
Record di allenamento
Audit ambientali

Wednesday, April 29, 2020

Useful tool: OOCL Carbon Calculator

OOCL Carbon Calculator

The OOCL Carbon Calculator demonstrates OOCL’s commitment to environmental care and will help our customers achieve the lowest possible carbon footprint in their end-to-end supply chain. Simple and easy to use, with just a few clicks, you can measure your carbon emissions for each shipment you make with OOCL, any time, anywhere.

OriginDestinationCargo Volume 
  TON or   TEU
Add Shipment  


Friday, January 3, 2020

Cities are set to miss 80% of their 2020 emission reduction goals

 Most cities that disclosed emissions reductions targets to CDP did not have goals for as early as 2020. Seventy percent of the more than 608 individual targets that cities self-reported in 2019 cite deadlines further in the future. Over 800 cities disclose some amount of data to the organization.

Source: https://qz.com/1760352/cities-are-set-to-miss-80-percent-of-their-2020-emission-reduction-goals/

Tuesday, December 31, 2019

Fossil CO2 and GHG emissions of all world countries, 2019

The global GHG emissions trend has increased since the beginning of the 21st century in comparison to the three previous decades, mainly due to the increase in CO2 emissions from China and the other emerging economies. As a result, the atmospheric concentrations of greenhouse gases substantially increased enhancing the natural greenhouse effect, which may negatively affect the life on the Earth. These issues are internationally addressed in the framework of UNFCCC; countries are developing national emissions inventories and propose/implement actions to mitigate GHG emissions. CO2 emissions, which are the main responsible for global warming are still increasing at world level despite climate change mitigation agreements. However, CO2 emissions within the EU28 have decreased in the last two decades. Human related activities largely influence the total CO2 emissions – particularly, power generation and road transport but also emissions from combustion in the residential and commercial sectors play a key role. Despite decreasing trends for total EU28 CO2 emissions, CO2 emissions per capita within the EU28 are still higher than the world average value.


Read more at https://edgar.jrc.ec.europa.eu/overview.php?v=booklet2019

Tuesday, August 6, 2019

can’t expand airports after declaring a climate emergency – let’s shift to low-carbon transport instead

The world may finally be waking to the reality of the climate and ecological crisis, after 30 years of inaction. But while the UK parliament has declared a climate and ecological emergency, ongoing plans for airport expansions suggest we’re flying full-speed towards crisis rather than away from it.

Globally, greenhouse gas emissions from aviation are rising rapidly, and set to further escalate. Passenger numbers are rising far too fast for efficiency improvements and alternative technologies, such as electric or biofuel-powered engines, to keep up. What’s worse, the climate impact of flights is two to three times larger than their CO₂ emissions alone, due to the release of nitrogen oxides – powerful greenhouse gases – and the contrails planes leave in their wake which trap even more heat in the atmosphere. The aviation industry has also evaded fuel taxes, emissions regulations, and is often completely omitted in emissions accounting.

This is particularly important as cities are setting targets to reduce their carbon emissions. While many of these cities have airports, their climate strategies tend to focus on the emissions released within the city’s boundaries and from their electricity use. They don’t account for emissions from imported goods and services that are consumed in the city but produced elsewhere, nor from flights through their airports. Any emissions from residents travelling outside the city are generally omitted.

Source: https://theconversation.com/we-cant-expand-airports-after-declaring-a-climate-emergency-lets-shift-to-low-carbon-transport-instead-120740

Monday, August 5, 2019

The Relationship Between Carbon Dioxide Emissions and Economic Growth

Aims: to understand past relationships between
national CO2 emissions and GDP to help inform current
debates about emission projections
Datasets considered:
– International Energy Agency
– Energy Information Administration (US DOE)
– CDIAC (US Oak Ridge)
– WRI CAIT
No major inconsistencies observed, EIA accessible for
general trend analysis, CDIAC and CAIT for data since
1950, WRI CAIT most complete for cross-comparisons
Population is an important factors; all comparisons
analysed on per-capita basis

Source: https://www.oxfordenergy.org/publications/the-relationship-between-carbon-dioxide-emissions-and-economic-growth/?v=69e1aafeccc5


Friday, August 2, 2019

Finnlines calculated passenger-specific route CO2 emissions

Finnlines calculated passenger-specific route CO2 emissions – Finnlines’ vessels are an eco-friendly choice for passengers

Passenger-specific carbon-dioxide figures for 2018 have been calculated on Finnlines’ passenger routes, Naantali–Kapellskär, Malmö–Travemünde and Helsinki–Travemünde. The figures will be updated on a yearly basis and this will be the base for future calculations.

International legislation and Finnlines’ figures

The EU regulation on the monitoring, reporting and verification of CO2 emissions (MRV, EU 2015/757, EN 16258) became fully effective in 2018. Globally, IMO’s similar Data Collection System will start in 2019.

The Finnlines’ passenger-specific route figures are calculated on the basis of MRV data for 2018 verified by the authorities. Finnlines’ figures have been verified by official certification society.

Finnlines’ ro-pax vessels carry both passengers and freight, and thus the total annual fuel and emission data is divided between these categories. The MRV standard (EN 16258) allows to select between two methods: the mass and area method. Since Finnlines’ operations are mostly concentrated in cargo and freight, it is logical that Finnlines uses the mass method where the freight / passenger ratio is allocated annually according to carried freight and passenger.

The total CO2 emissions of the Finnlines’ fleet have reduced by approximately 30% in 2018 compared to 2008. Route-specific reductions can even be more due to better capacity utilisation.

In 2018, CO2 emissions per passenger on routes:

Naantali–Kapellskär was 13–14 kg CO2/passenger (MS Finnswan, MS Finnfellow)
Malmö–Travemünde was 15–16 kg CO2/passenger (MS Europalink, MS Finnpartner, MS Finntrader)
Helsinki–Travemünde was 69–79 kg CO2/passenger (MS Finnlady, MS Finnmaid, MS Finnstar).
Differences are due to passenger numbers and, for example, weather conditions and route choices.

Clear emission goals & new eco-efficient ships

continue reading at https://seanews.co.uk/news/global-events/finnlines-calculated-passenger-specific-route-co2-emissions/