Friday, August 30, 2019

Roads / Environment / Light vehicle emissions

The NTC began reporting on the carbon dioxide emissions of new cars and light commercial vehicles in 2009, to provide a transparent benchmark for how Australia’s new car emissions performance is tracking.

Light vehicle emissions
The NTC reports on the carbon dioxide emissions intensity of new cars and light commercial vehicle sales to provide a transparent benchmark for how Australia’s new car emission performance is tracking.

Key findings from our latest report:
In 2018 the national average carbon dioxide emissions intensity from new passenger and light commercial vehicles was 1 80.9 g/km. This is a 0.4 per cent improvement from 2017. This is the second lowest annual improvement since records started in 2002.
Consumer preferences are an important factor affecting the national average of carbon dioxide emissions intensity for new vehicles. If all Australians who purchased new vehicles in 2018 had purchased vehicles with best-in-class emissions, the national average carbon dioxide emissions intensity would have been reduced to 73 g/km, a 60 per cent reduction.
About 91 per cent of all new vehicle sales in 201 8 were from 15 makes. Of these 15 makes, Audi had the lowest corporate average emissions intensity (148 g/km), and Ford had the highest (216 g/km).

Source
California Greenhouse Gas Emissions for 2000 to 2017 Trends of Emissions and Other Indicators

The annual statewide greenhouse gas (GHG) emission inventory is an important tool in
tracking progress towards meeting statewide GHG goals. The inventory for 2017 shows that
California’s GHG emissions continue to decrease. In 2017, emissions from GHG emitting
activities statewide were 424 million metric tons of CO2 equivalent (MMTCO2e), 5 MMTCO2e
lower than 2016 levels and 7 MMTCO2e below the 2020 GHG Limit of 431 MMTCO2e.
Consistent with recent years, these reductions have occurred while California’s economy has
continued to grow and generate jobs. Compared to 2016, California’s GDP grew 3.6 percent
while the carbon intensity of its economy declined by 4.5 percent. The most notable highlights in
the inventory include:
• For the first time since California started to track GHG emissions, in-state and total
electricity generation from zero-GHG sources (for purposes of the GHG inventory,
these include solar, hydro, wind, and nuclear) exceeded generation from GHGemitting sources.
• The transportation sector remains the largest source of GHG emissions in the state,
but saw a 1 percent increase in emissions in 2017, the lowest growth rate over the
past 4 years.
• Emissions from all other sectors have remained relatively constant in recent years,
although emissions from high Global Warming Potential (GWP) gases have continued
to increase as they replace Ozone Depleting Substances (ODS) banned under the
1987 Montreal Protocol.

source: https://ww3.arb.ca.gov/cc/inventory/pubs/reports/2000_2017/ghg_inventory_trends_00-17.pdf

Study: China may hit emission goals early

An international study has found that China is on track to meet its carbon emissions goals up to one decade early.

China, one of the first countries to sign the Paris Agreement on climate change, has pledged to halt the rise in carbon dioxide emissions by around 2030.

Researchers from China's Nanjing University, Tsinghua University, Chinese Academy of Sciences and Harvard University in the United States examined carbon dioxide emissions from 50 Chinese cities from 2000 to 2016 and found a close relationship between per capita emissions and per capita gross domestic product.

Those 50 cities account for about 35 percent of China's total carbon emissions and 51 percent of the country's GDP.

source: http://www.chinadaily.com.cn/global/2019-08/27/content_37505778.htm

Wednesday, August 28, 2019

Huge carbon monoxide plume from Amazon rainforest fires

The devastating effect of the Amazon forest fires on our planet have been revealed in a NASA time series.

The images, created using data from NASA's Atmospheric Infrared Sounder (AIRS) instrument aboard the Aqua satellite, show a giant carbon monoxide plume gathering over Brazil.

Source: https://www.mirror.co.uk/science/huge-carbon-monoxide-plume-amazon-19007167

Thursday, August 15, 2019

Transportation GHG emissions

GHG spotlight on transportation
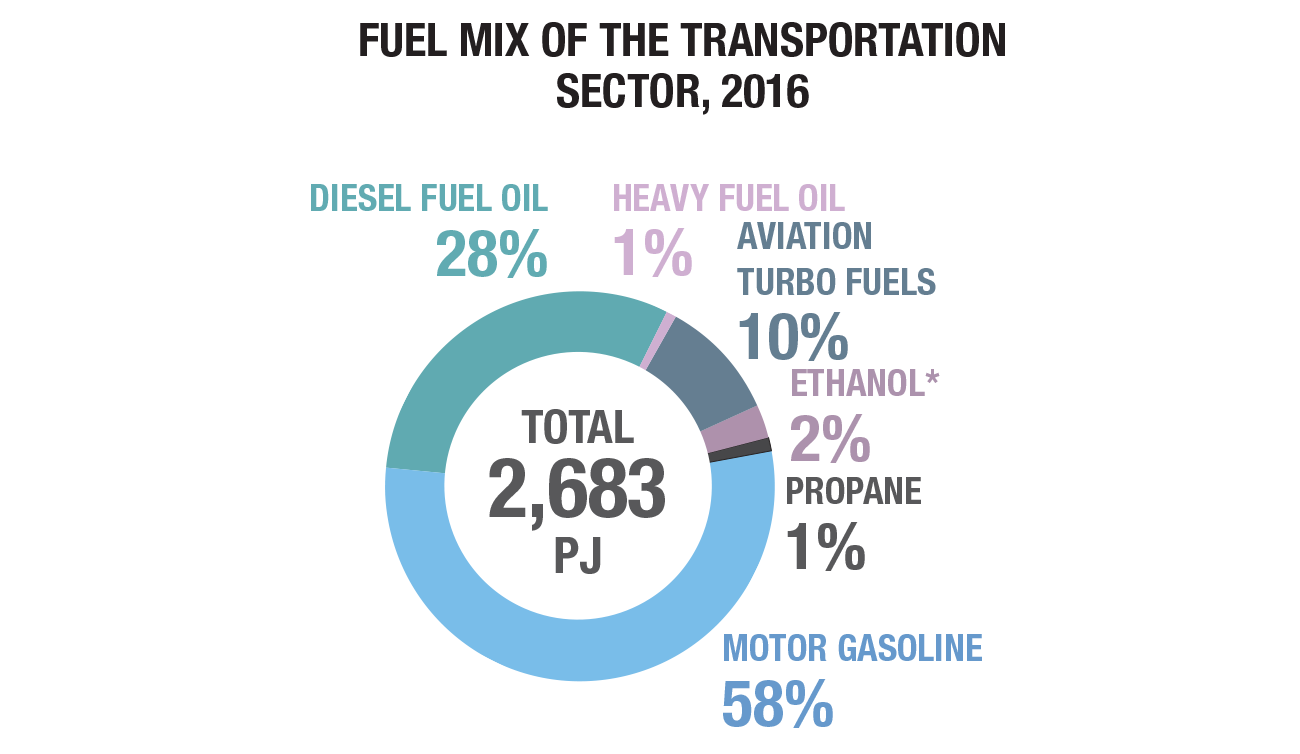
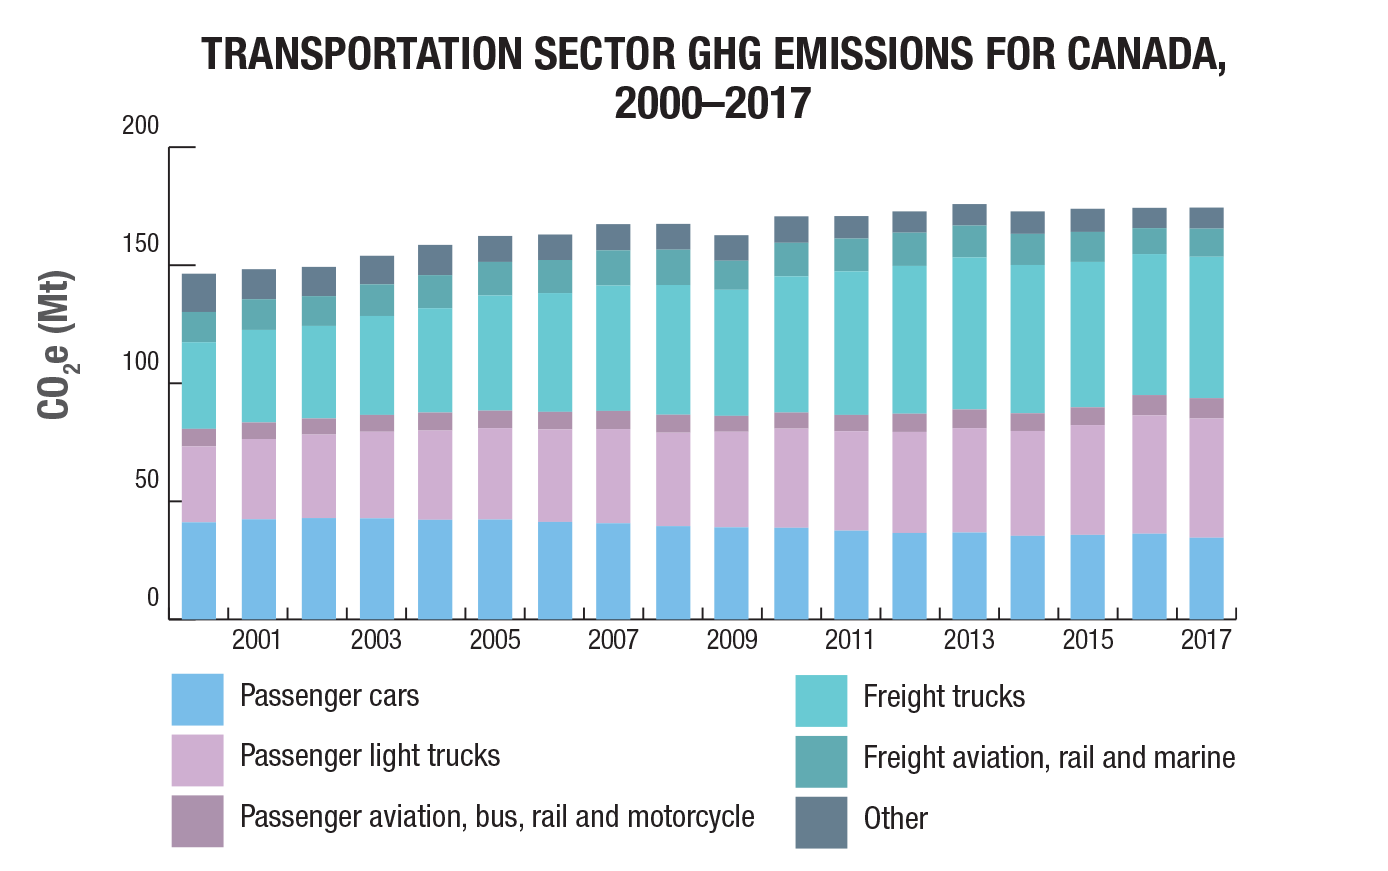
Transportation GHG emissions have increased 19% from 2000 to 2017. Emissions from passenger light trucks and freight trucks have continued to rise due to an increased number of vehicles (especially light trucks and SUVs). Freight emissions have increased due to many factors including increasing trade and globalization, and online shopping.


Passenger transportation contributes 54% to total emissions, freight emissions are 41% of total and off-road is 5%.

Energy efficiency improvements in the transportation sector have saved Canadians 763 PJ of energy and almost $20.8 billion in energy costs in 2016.

Total transportation energy use increased 16% from 2000 to 2016.


Source: https://www.nrcan.gc.ca/energy-and-greenhouse-gas-emissions-ghgs/20063#L1

Total electricity emissions / GHG emissions on electricity

GHG spotlight on electricity
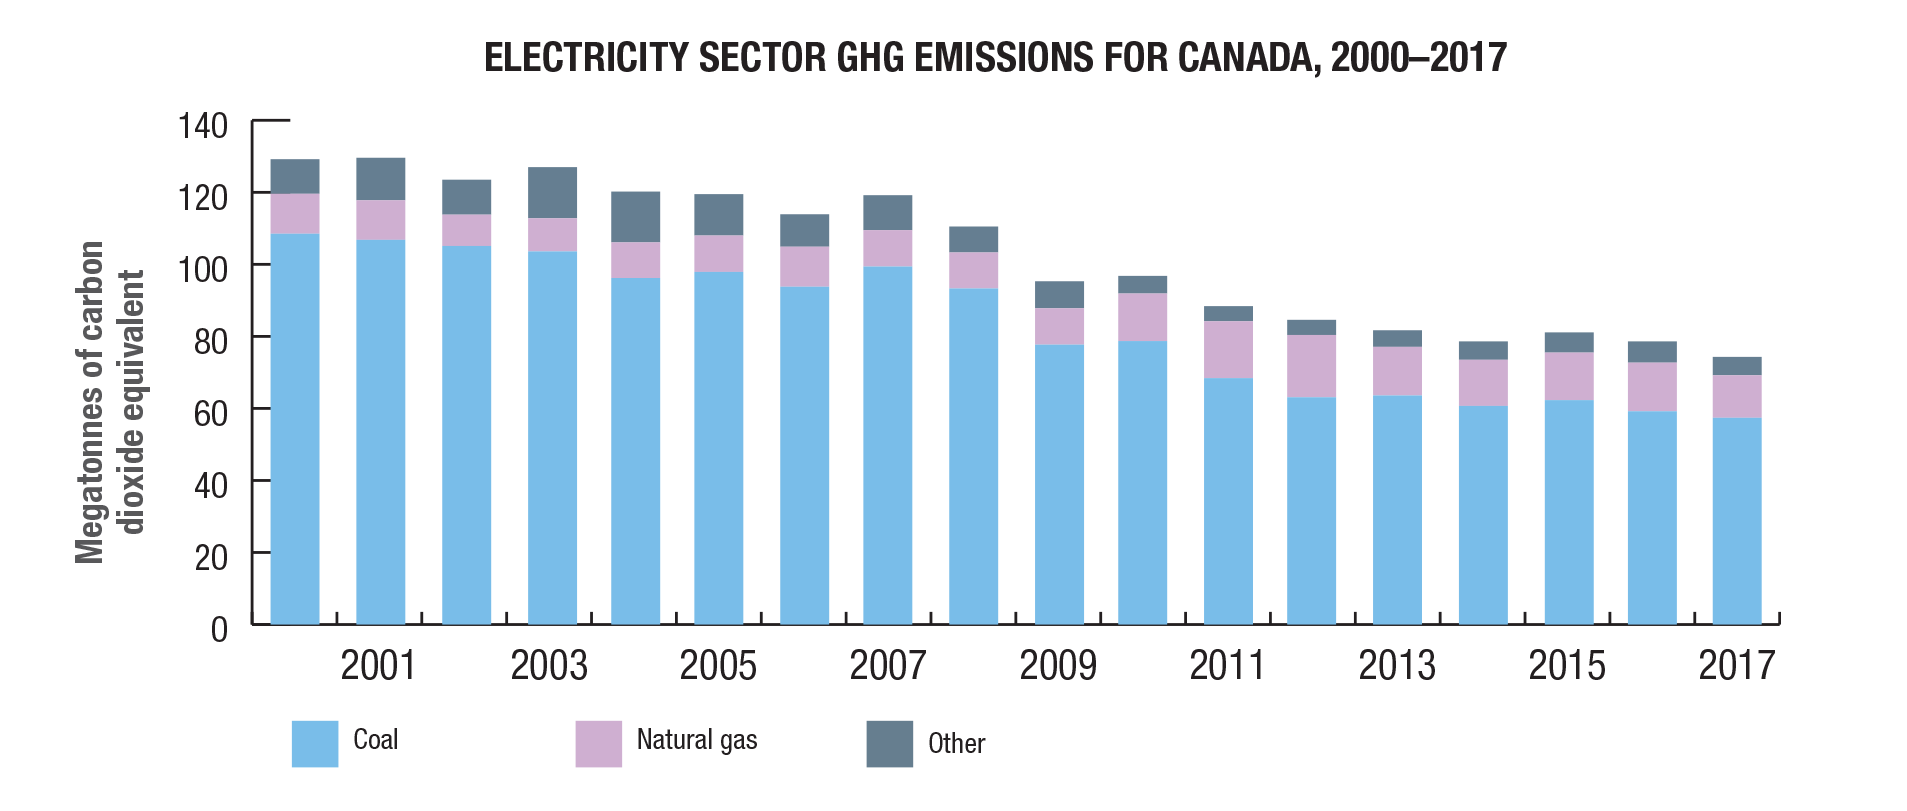
Despite accounting for less than 9% of total electricity generation, coal was responsible for 77% of electricity related GHG emissions in 2017. Total electricity emissions decreased by 42% from 2000 to 2017 due to increased generation from non-emitting sources.


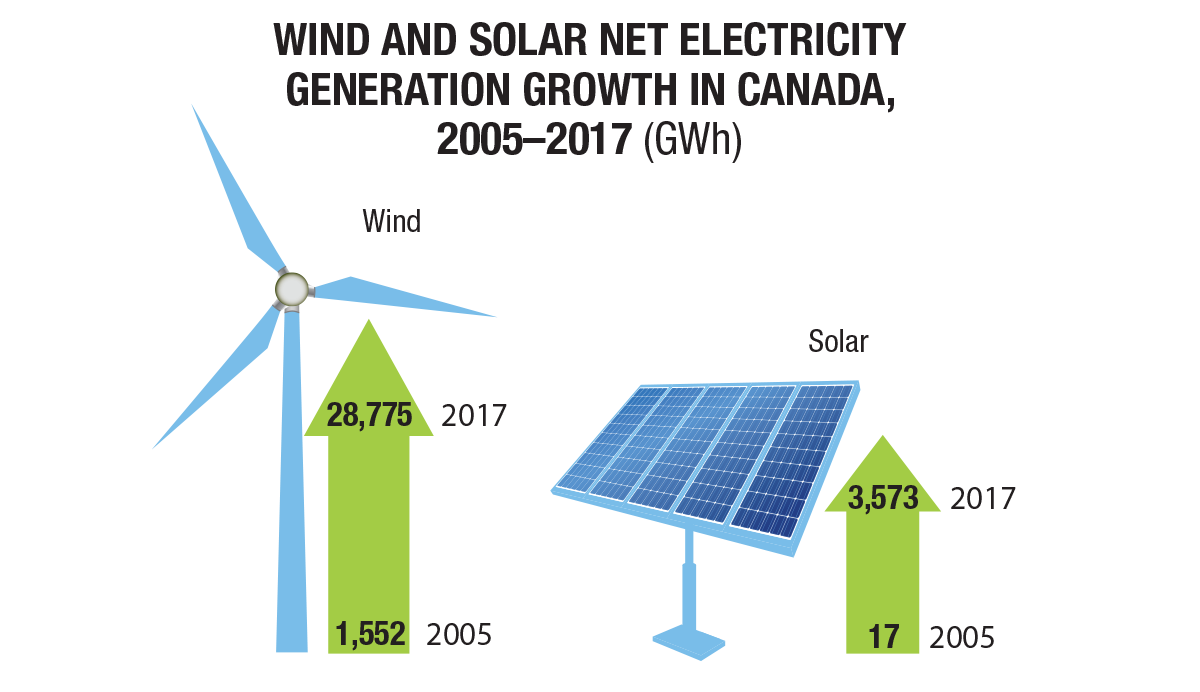
Renewable electricity generation has increased 18% between 2010 and 2017, with solar and wind having largest growth.

In 2017, almost 82% of electricity in Canada came from non-GHG emitting sources. Hydro made up 60%, nuclear 15%, and other renewables the remaining 7%.

Renewable energy sources make up 2/3’s of Canada’s electricity mix. Renewable electricity generation has increased 18% between 2010 and 2017, with solar and wind having largest growth.


Source: https://www.nrcan.gc.ca/energy-and-greenhouse-gas-emissions-ghgs/20063#L1

Wednesday, August 14, 2019

GHG spotlight on oil and gas

GHG spotlight on oil and gas
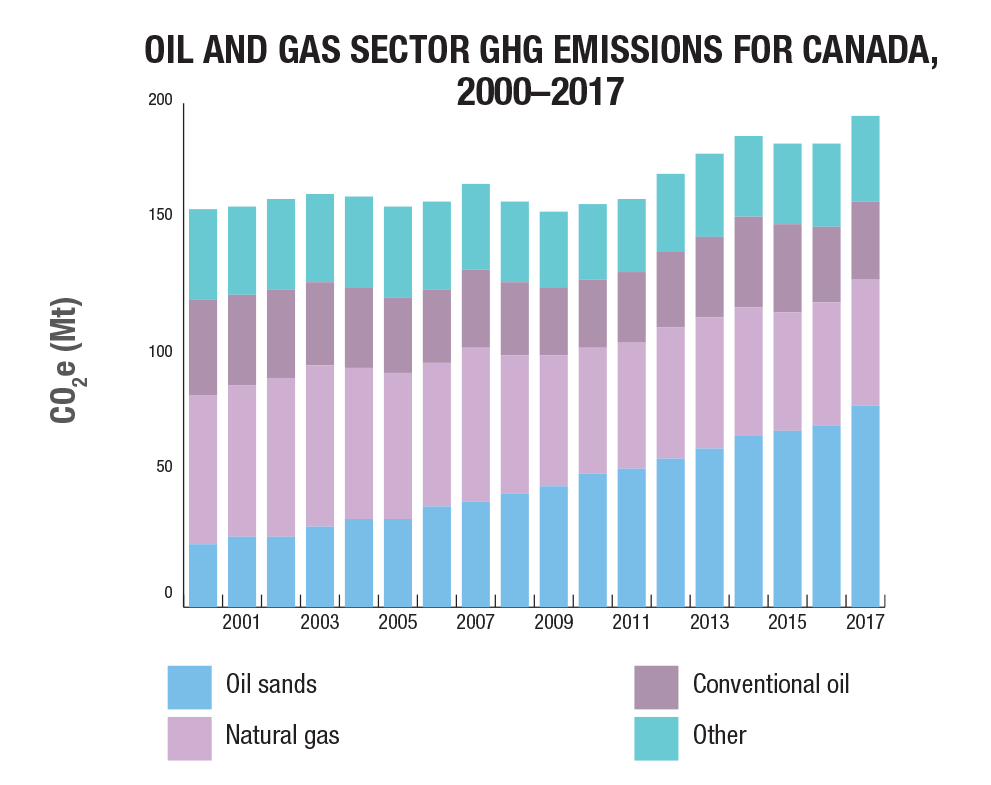
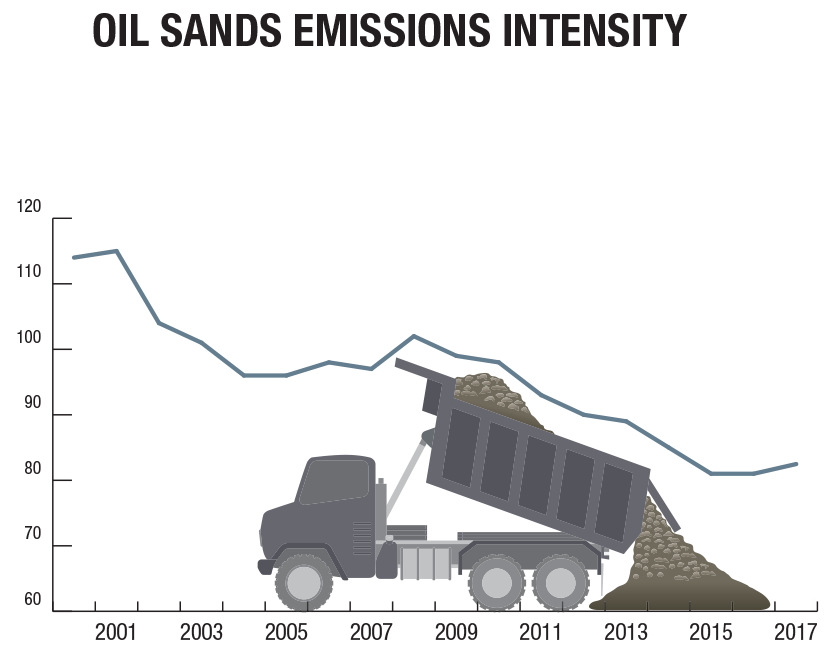
GHG emissions from oil and gas production have gone up 23% between 2005 and 2017, largely from increased oil sands production, particularly in-situ extraction.


The Government of Canada has committed to reducing methane emissions from the oil and gas sector by 40% to 45% from 2012 levels by 2025. New regulations limiting methane emissions from fugitive sources such as leaks and venting will apply to the oil and gas sector beginning in 2020.


Source: https://www.nrcan.gc.ca/energy-and-greenhouse-gas-emissions-ghgs/20063#L1

Energy use and greenhouse gas emissions

Energy use and greenhouse gas emissions
A wide variety of factors have an influence on the level of GHG emissions in Canada. Globally, about 78% of GHG emissions from human activity are from the production and consumption of energy. This includes activities such as using gasoline for transportation, non-renewable electricity production, oil and gas production, and heating and cooling of buildings.

In Canada, over 81% of emissions come from energy. Canadians use more energy due to our extreme temperatures, vast landscape and dispersed population.

Source: https://www.nrcan.gc.ca/energy-and-greenhouse-gas-emissions-ghgs/20063#L1

Energy and Greenhouse Gas Emissions (GHGs) | Natural Resources Canada

Energy and Greenhouse Gas Emissions (GHGs)

Protecting the environment and growing the economy go hand in hand. Taking action on climate change means reducing emissions and increasing climate resilience, while helping Canada diversify its economy and generate well-paying jobs.

Key Facts
In 2017, 82% of electricity in Canada came from non-GHG emitting sources
Energy consumption grew by 26% between 1990 and 2016
Energy efficiency improved by 31% between 1990 and 2016
Investment in clean energy technology was over $3.3 billion in 2017

Source: https://www.nrcan.gc.ca/energy-and-greenhouse-gas-emissions-ghgs/20063#L1

Tuesday, August 6, 2019

can’t expand airports after declaring a climate emergency – let’s shift to low-carbon transport instead

The world may finally be waking to the reality of the climate and ecological crisis, after 30 years of inaction. But while the UK parliament has declared a climate and ecological emergency, ongoing plans for airport expansions suggest we’re flying full-speed towards crisis rather than away from it.

Globally, greenhouse gas emissions from aviation are rising rapidly, and set to further escalate. Passenger numbers are rising far too fast for efficiency improvements and alternative technologies, such as electric or biofuel-powered engines, to keep up. What’s worse, the climate impact of flights is two to three times larger than their CO₂ emissions alone, due to the release of nitrogen oxides – powerful greenhouse gases – and the contrails planes leave in their wake which trap even more heat in the atmosphere. The aviation industry has also evaded fuel taxes, emissions regulations, and is often completely omitted in emissions accounting.

This is particularly important as cities are setting targets to reduce their carbon emissions. While many of these cities have airports, their climate strategies tend to focus on the emissions released within the city’s boundaries and from their electricity use. They don’t account for emissions from imported goods and services that are consumed in the city but produced elsewhere, nor from flights through their airports. Any emissions from residents travelling outside the city are generally omitted.

Source: https://theconversation.com/we-cant-expand-airports-after-declaring-a-climate-emergency-lets-shift-to-low-carbon-transport-instead-120740

Monday, August 5, 2019

The Relationship Between Carbon Dioxide Emissions and Economic Growth

Aims: to understand past relationships between
national CO2 emissions and GDP to help inform current
debates about emission projections
Datasets considered:
– International Energy Agency
– Energy Information Administration (US DOE)
– CDIAC (US Oak Ridge)
– WRI CAIT
No major inconsistencies observed, EIA accessible for
general trend analysis, CDIAC and CAIT for data since
1950, WRI CAIT most complete for cross-comparisons
Population is an important factors; all comparisons
analysed on per-capita basis

Source: https://www.oxfordenergy.org/publications/the-relationship-between-carbon-dioxide-emissions-and-economic-growth/?v=69e1aafeccc5


Greenhouse Gas Emissions in Hong Kong

Greenhouse Gas Emissions in Hong Kong
Greenhouse gas emissions by sector
Greenhouse gas emissions and carbon intensity
Greenhouse gas emission trends


按排放源劃分的香港溫室氣體排放量
Greenhouse Gas Emissions in Hong Kong by Sector
溫室氣體排放量 (千公噸二氧化碳當量)
Greenhouse gas emissions (in kilotonnes CO2-e)
能源
Energy
廢棄物
Waste
工業過程及產品使用
Industrial Processes and Product Use
農業、林業及其他土地利用
Agriculture, Forestry and Other Land Use
發電#
Electricity
Generation#
運輸
Transport
其它燃料耗用
Other End Use of Fuel@


1990 年至 2017 年香港溫室氣體排放趨勢
Greenhouse Gas Emission Trends of Hong Kong from 1990–2017 

香港的溫室氣體排放量及碳強度 Greenhouse Gas Emissions and Carbon Intensity in Hong Kong 年份 Year 溫室氣體排放總量 (千公噸二氧化碳當量) Total GHG emissions (kilotonnes CO2-e) 人均排放 (公噸二氧化碳當量) Per capita emissions (tonnes CO2-e) 碳強度 (千克二氧化碳當量/港元本地生產總值) Carbon Intensity (kg CO2-e per HK Dollar GDP) 

Friday, August 2, 2019

IDEO CONCEPTS launches emission data management system EMS

The online data management system will help listed companies with GHG emission requirements. The new greenhouse gas (GHG) online data management system supports data collection, data transformation, data report creation. User upload collected data directly into web-based EMS. Emission calculation will automatically generate report data based on pre-configured annually emission factors from different providers/countries. FREE guideline is provided during the import process.

Finnlines calculated passenger-specific route CO2 emissions

Finnlines calculated passenger-specific route CO2 emissions – Finnlines’ vessels are an eco-friendly choice for passengers

Passenger-specific carbon-dioxide figures for 2018 have been calculated on Finnlines’ passenger routes, Naantali–Kapellskär, Malmö–Travemünde and Helsinki–Travemünde. The figures will be updated on a yearly basis and this will be the base for future calculations.

International legislation and Finnlines’ figures

The EU regulation on the monitoring, reporting and verification of CO2 emissions (MRV, EU 2015/757, EN 16258) became fully effective in 2018. Globally, IMO’s similar Data Collection System will start in 2019.

The Finnlines’ passenger-specific route figures are calculated on the basis of MRV data for 2018 verified by the authorities. Finnlines’ figures have been verified by official certification society.

Finnlines’ ro-pax vessels carry both passengers and freight, and thus the total annual fuel and emission data is divided between these categories. The MRV standard (EN 16258) allows to select between two methods: the mass and area method. Since Finnlines’ operations are mostly concentrated in cargo and freight, it is logical that Finnlines uses the mass method where the freight / passenger ratio is allocated annually according to carried freight and passenger.

The total CO2 emissions of the Finnlines’ fleet have reduced by approximately 30% in 2018 compared to 2008. Route-specific reductions can even be more due to better capacity utilisation.

In 2018, CO2 emissions per passenger on routes:

Naantali–Kapellskär was 13–14 kg CO2/passenger (MS Finnswan, MS Finnfellow)
Malmö–Travemünde was 15–16 kg CO2/passenger (MS Europalink, MS Finnpartner, MS Finntrader)
Helsinki–Travemünde was 69–79 kg CO2/passenger (MS Finnlady, MS Finnmaid, MS Finnstar).
Differences are due to passenger numbers and, for example, weather conditions and route choices.

Clear emission goals & new eco-efficient ships

continue reading at https://seanews.co.uk/news/global-events/finnlines-calculated-passenger-specific-route-co2-emissions/